November 2, 2026 — the eve of the U.S. midterms
Everyone knows that the President’s party usually loses seats in the midterms in the House and, to a lesser extent, in the Senate. That means there’s a one-variable predictor (which party the President belongs to) to the outcome of the results, but I wanted to add a second predictor which is readily available and quantifiable: the net approval/disapproval of the President.
I took the 20 midterms from 1946 to 2022 and tried three increasingly ambitious ways to predict Democratic seat gains: M0, their historical average; M1, add the president’s party; M2, also add the president’s net approval (approval minus disapproval).
How much do we learn?
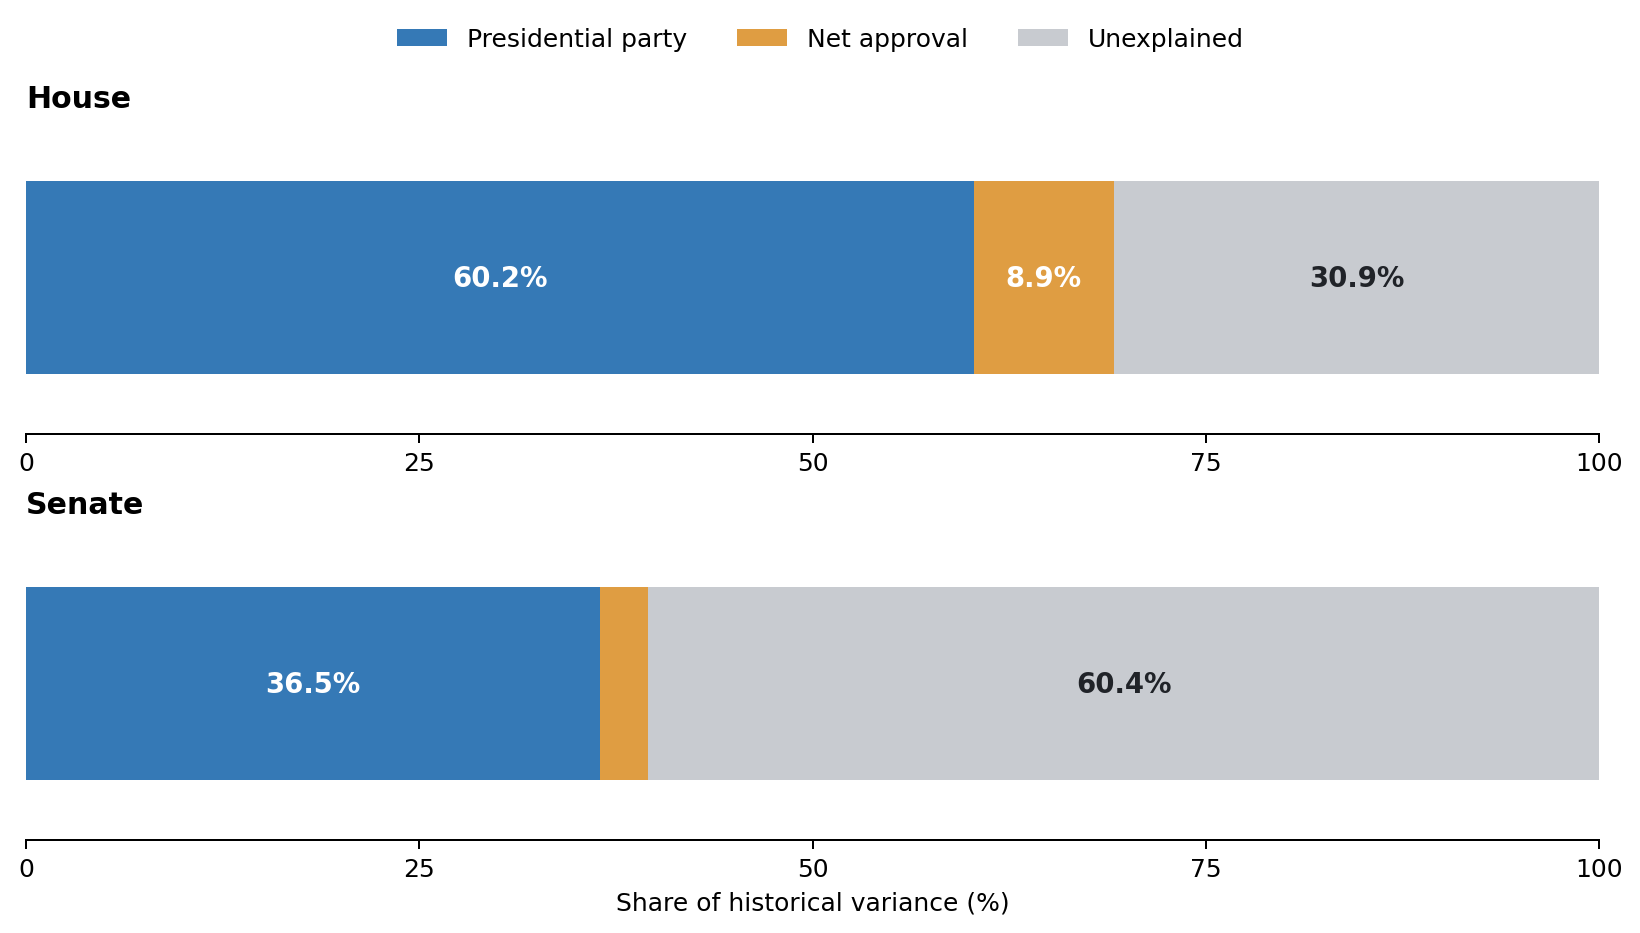
Presidential party alone explains 60% of the historical variation in House results, and 36% in the Senate. Approval explains another 9 percentage points of total House variance, but just 3 in the Senate. Not exactly a crystal ball.
And there’s a tougher test: leave one election out, fit on the other 19, and see how far off we are.
| Model | House error (seats) | Senate error (seats) |
|---|---|---|
| M0: historical Democratic average | 34.8 | 6.19 |
| M1: + president’s party | 23.2 | 5.20 |
| M2: + net approval | 21.2 | 5.43 |
Errors are leave-one-election-out root mean squared errors (LOOCV RMSE). Lower is better. Approval helps in the House; in the Senate, it actually makes the held-out predictions slightly worse.
The House
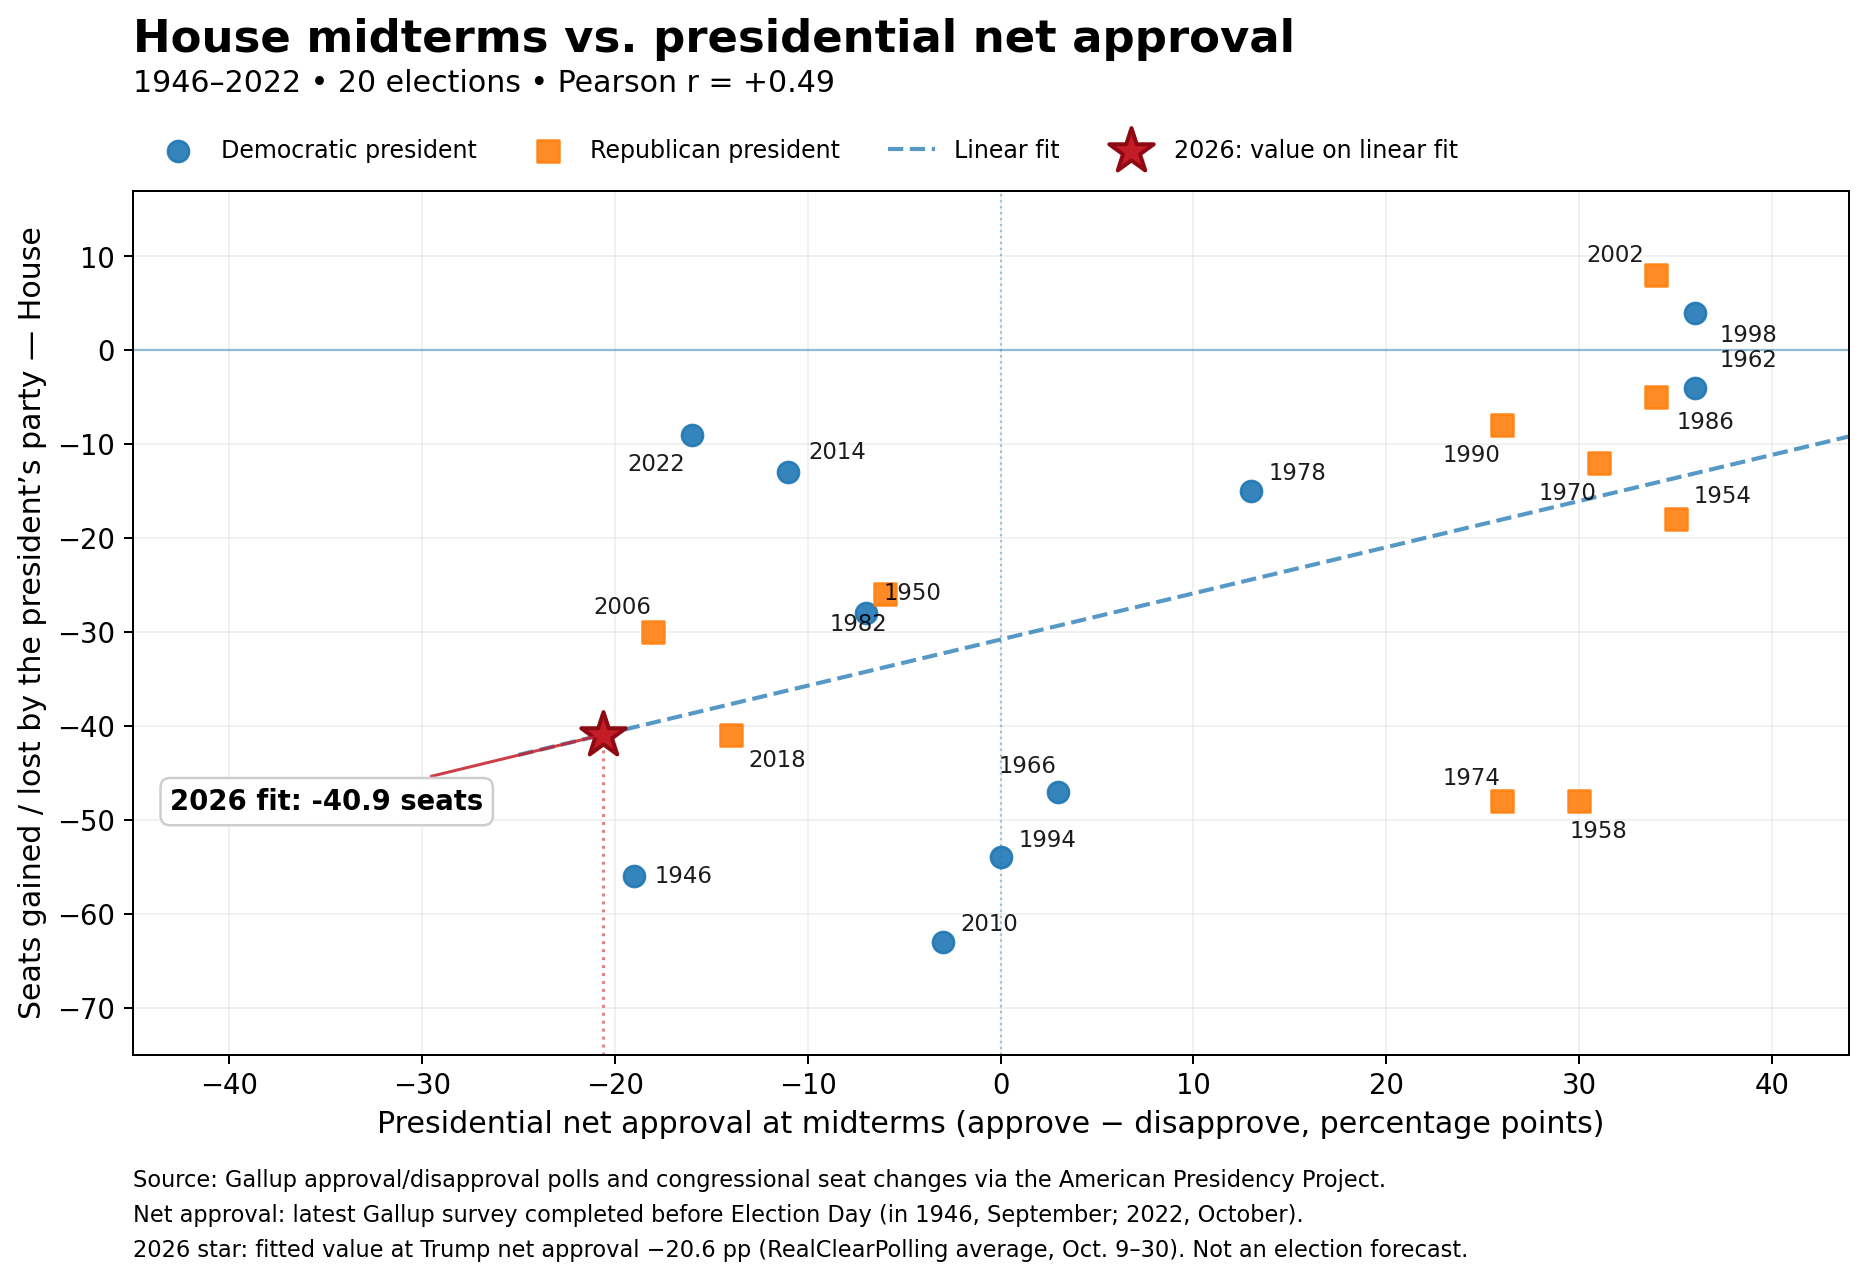
The president’s party has lost 25.7 House seats on average. More popular presidents fare better, but the correlation is only r = +0.49.
The Senate
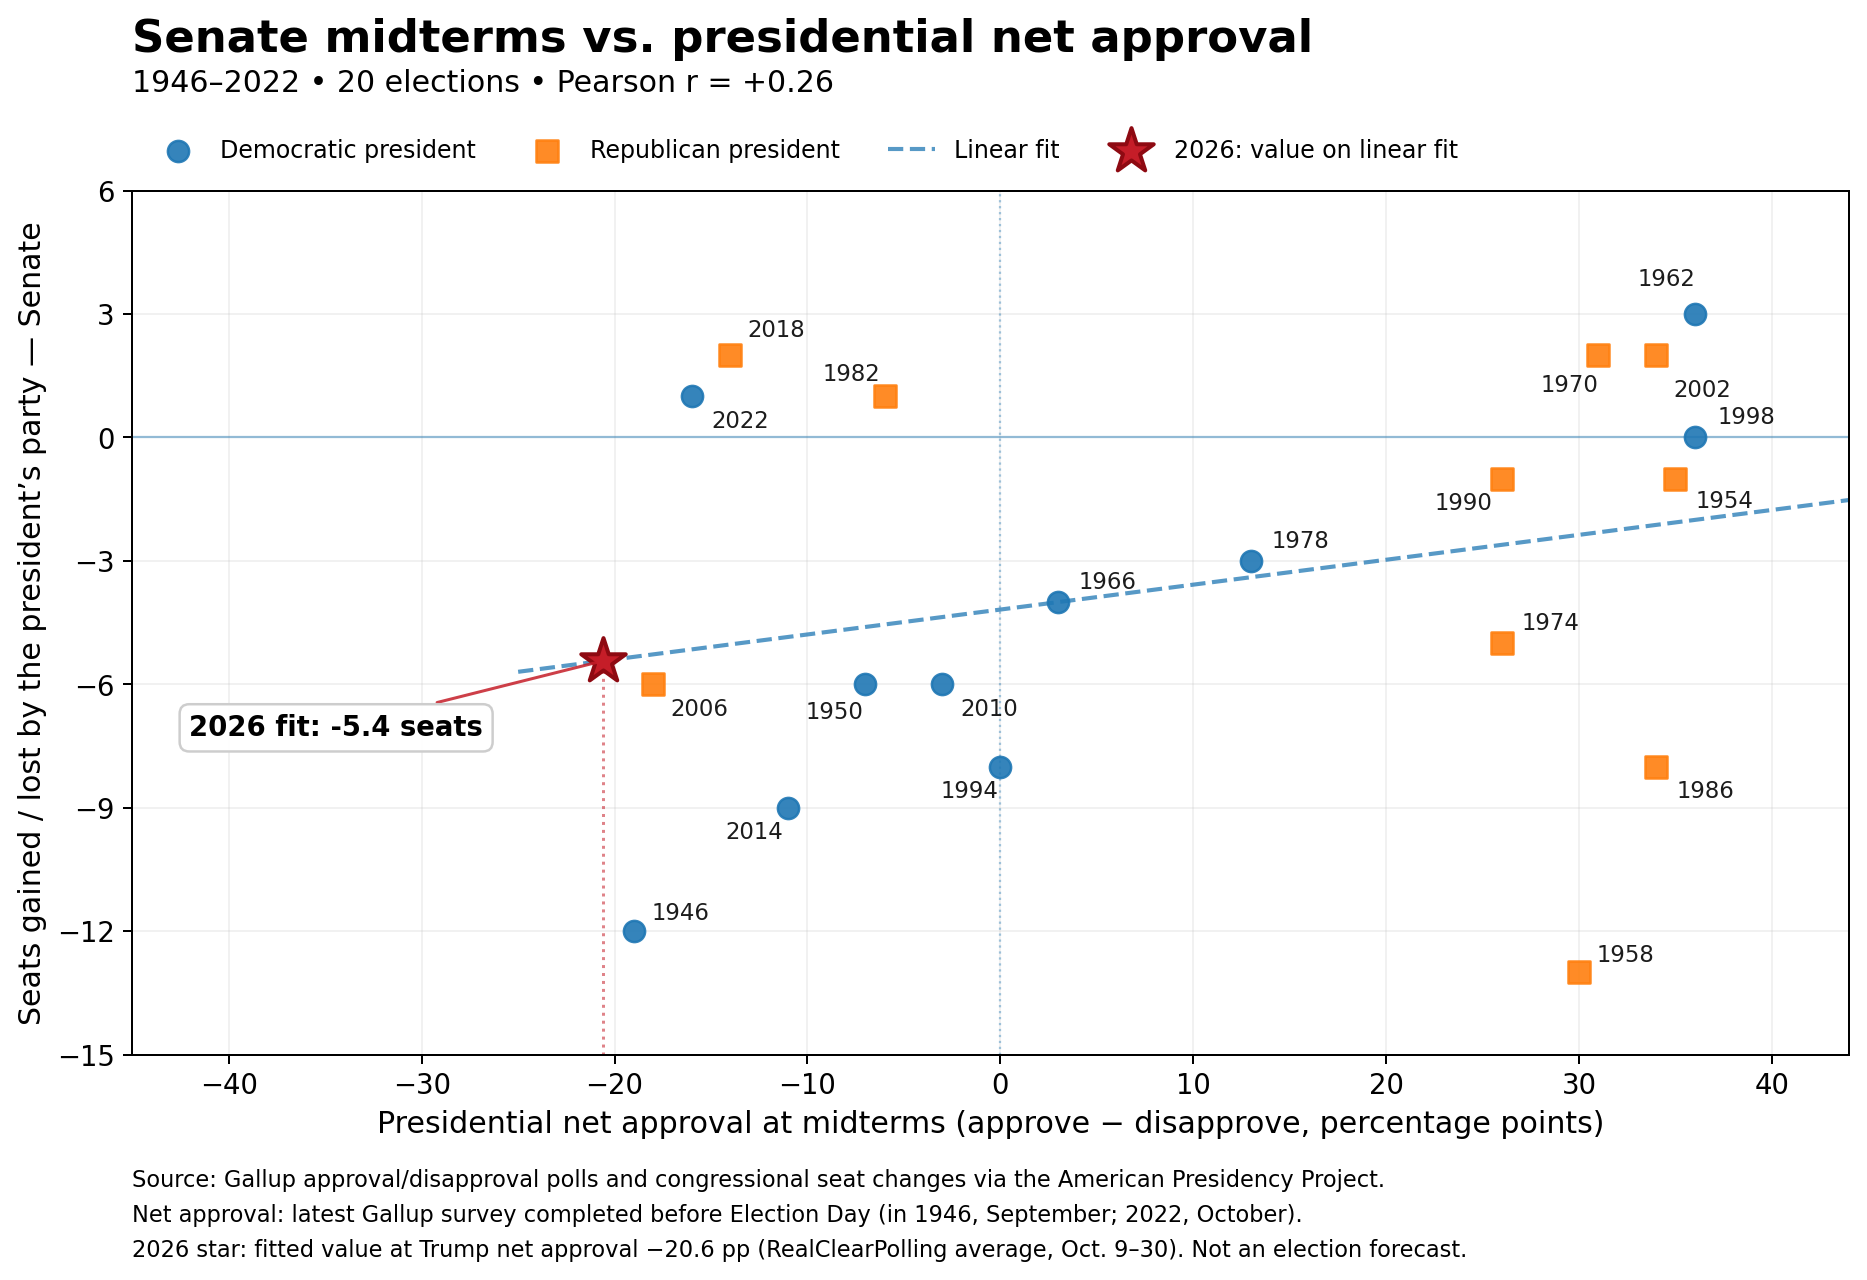
The average presidential-party loss is 3.6 seats, and the approval correlation is a modest r = +0.26. Which Senate seats happen to be up for election matters enormously.
And tomorrow?
The RealClearPolling average for October 9–30 puts Trump’s approval at 38.8%, disapproval at 59.4%: net −20.6 points.
Placing that value on the simple historical lines in the two scatterplots gives:
| Chamber | Historical presidential-party average | Value on scatterplot’s linear fit |
|---|---|---|
| House | −25.7 | −40.9 |
| Senate | −3.6 | −5.4 |
Those are the red stars, not election forecasts. The plotted lines are regressions of presidential-party seat changes on approval; the three-model comparison above instead models signed Democratic seat changes, with a free intercept.
Data
| Year | President | Net approval (pp) | President’s party: House | Senate |
|---|---|---|---|---|
| 1946 | Truman (D) | -19 | -56 | -12 |
| 1950 | Truman (D) | -7 | -28 | -6 |
| 1954 | Eisenhower (R) | +35 | -18 | -1 |
| 1958 | Eisenhower (R) | +30 | -48 | -13 |
| 1962 | Kennedy (D) | +36 | -4 | +3 |
| 1966 | L. B. Johnson (D) | +3 | -47 | -4 |
| 1970 | Nixon (R) | +31 | -12 | +2 |
| 1974 | Ford (R) | +26 | -48 | -5 |
| 1978 | Carter (D) | +13 | -15 | -3 |
| 1982 | Reagan (R) | -6 | -26 | +1 |
| 1986 | Reagan (R) | +34 | -5 | -8 |
| 1990 | G. H. W. Bush (R) | +26 | -8 | -1 |
| 1994 | Clinton (D) | 0 | -54 | -8 |
| 1998 | Clinton (D) | +36 | +4 | 0 |
| 2002 | G. W. Bush (R) | +34 | +8 | +2 |
| 2006 | G. W. Bush (R) | -18 | -30 | -6 |
| 2010 | Obama (D) | -3 | -63 | -6 |
| 2014 | Obama (D) | -11 | -13 | -9 |
| 2018 | Trump (R) | -14 | -41 | +2 |
| 2022 | Biden (D) | -16 | -9 | +1 |
Approval readings are the latest available pre-election Gallup surveys. Sources: American Presidency Project — approval, American Presidency Project — seat changes, and RealClearPolling — Trump approval.


Leave a Reply