As of today, October 8, 2026, the New York Times’ presidential approval graphic labels approval of Trump at 37% and disapproval at 60%.
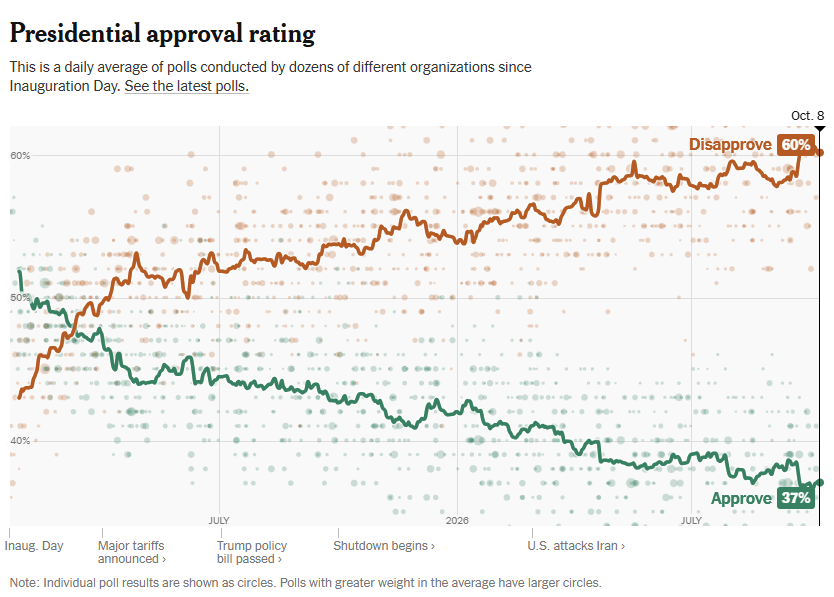
I can’t be sure of how they weight the polls, how they exclude outliers, etc., nor whether their “current” value actually represents a rolling aggregation centered on a past date — but it seems to me that the labels have a non-negligible delay. The median of the 10 latest “select” polls shown in the list is 33% approval and 63% disapproval — a net disapproval of 30 percentage points, 7 percentage points more than the 23 percentage points that their graphic suggests.
The second issue is the accompanying text, which says that the approval rating has been “low and steady for months.”
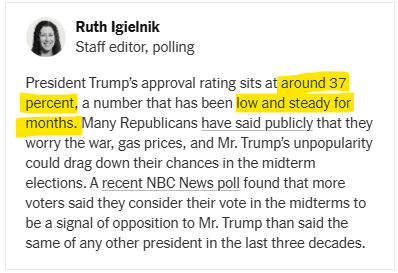
I would change steady to gradually declining.
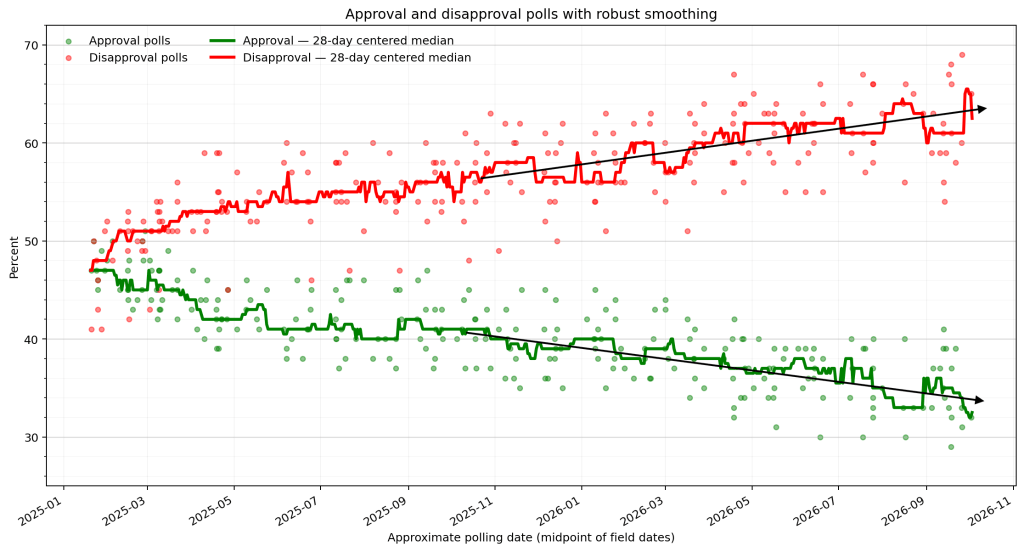
Looking at the “select” (quality) polls from November 1, 2025 onward, a robust Theil–Sen trend gives an approval decline of 0.55 percentage point per month and a disapproval increase of 0.57 percentage point per month. The fitted values move from roughly 41.1% approval and 56.8% disapproval at the beginning of November to about 35.0% approval and 63.2% disapproval by the latest polling dates. For months, the net disapproval has been increasing by slightly more than 1 percentage point per month: it is not steady, it is gradually increasing.
Besides, I would not use low for such approval numbers. I find approval in this range grotesquely high for the most incompetent leader the US has ever had, a pathological narcissist incapable of empathy or sympathy for anyone but himself in the country he is supposed to lead, who will break every single promise his supporters stupidly believed.
Note: data analysis of 248 “select” polls listed by the New York Times from Jan. 20–21, 2025 until Sept. 30–Oct. 5, 2026. Red and green lines show 28-day centered rolling median. Theil–Sen linear trends of the approval and disapproval are not shown — the black arrows are visual approximations.


Leave a comment