
According to Wikipedia:
The term “vibe coding” was coined by Andrej Karpathy in February 2025; Merriam-Webster listed it as “slang & trending” in March 2025; and Collins picked it as Word of the Year for 2025 (link, link, link).
Back then, in early 2025, it was a more-or-less derisive term, depending on who used it. It came with a strong assumption of serious limitations, criticisms about security flaws, and the idea that “it’s for beginners / non-coders”, not for experienced developers.
But now, two and a half months into 2026, the data shows the term’s usage is still growing. The tools that rode a wave of hype related to vibe coding in 2025 did not all survive the hype cycle. But the broader behavior of using coding agents is becoming more entrenched, and the term “vibe coding” is still in active use in early 2026.
Quick caveat: This post is based on Google Trends but Google Trends gives relative values (0-100), not absolute search volume. So we see “how interest moved” within each trend, we cannot compare directly trends between one another. Even search volume in turn, is only a proxy for interest, not a direct usage meter.
Two peaks in 2025, then a higher 2026 level
From Chart 1a/1b, the “vibe coding” query shows two clear peaks in 2025:
- Spring 2025 (first real breakout, around late March / early April)
- August 2025 (a second, larger wave, from a summer baseline around the 40s to a weekly peak near 80, then a slight cooldown)
In the last two and a half months (January to mid-March 2026), there looks to be a continued expansion: we see 83 in mid-January and 100 in late February, and March remains elevated.
A cleaner way to summarize the magnitude: from the March 23, 2025 local high (59) to the February-March 2026 average (about 82), the level is up by roughly 40%.
Chart 1a: Core terms (Vibe Coding, Cursor, Claude Code, GitHub Copilot)
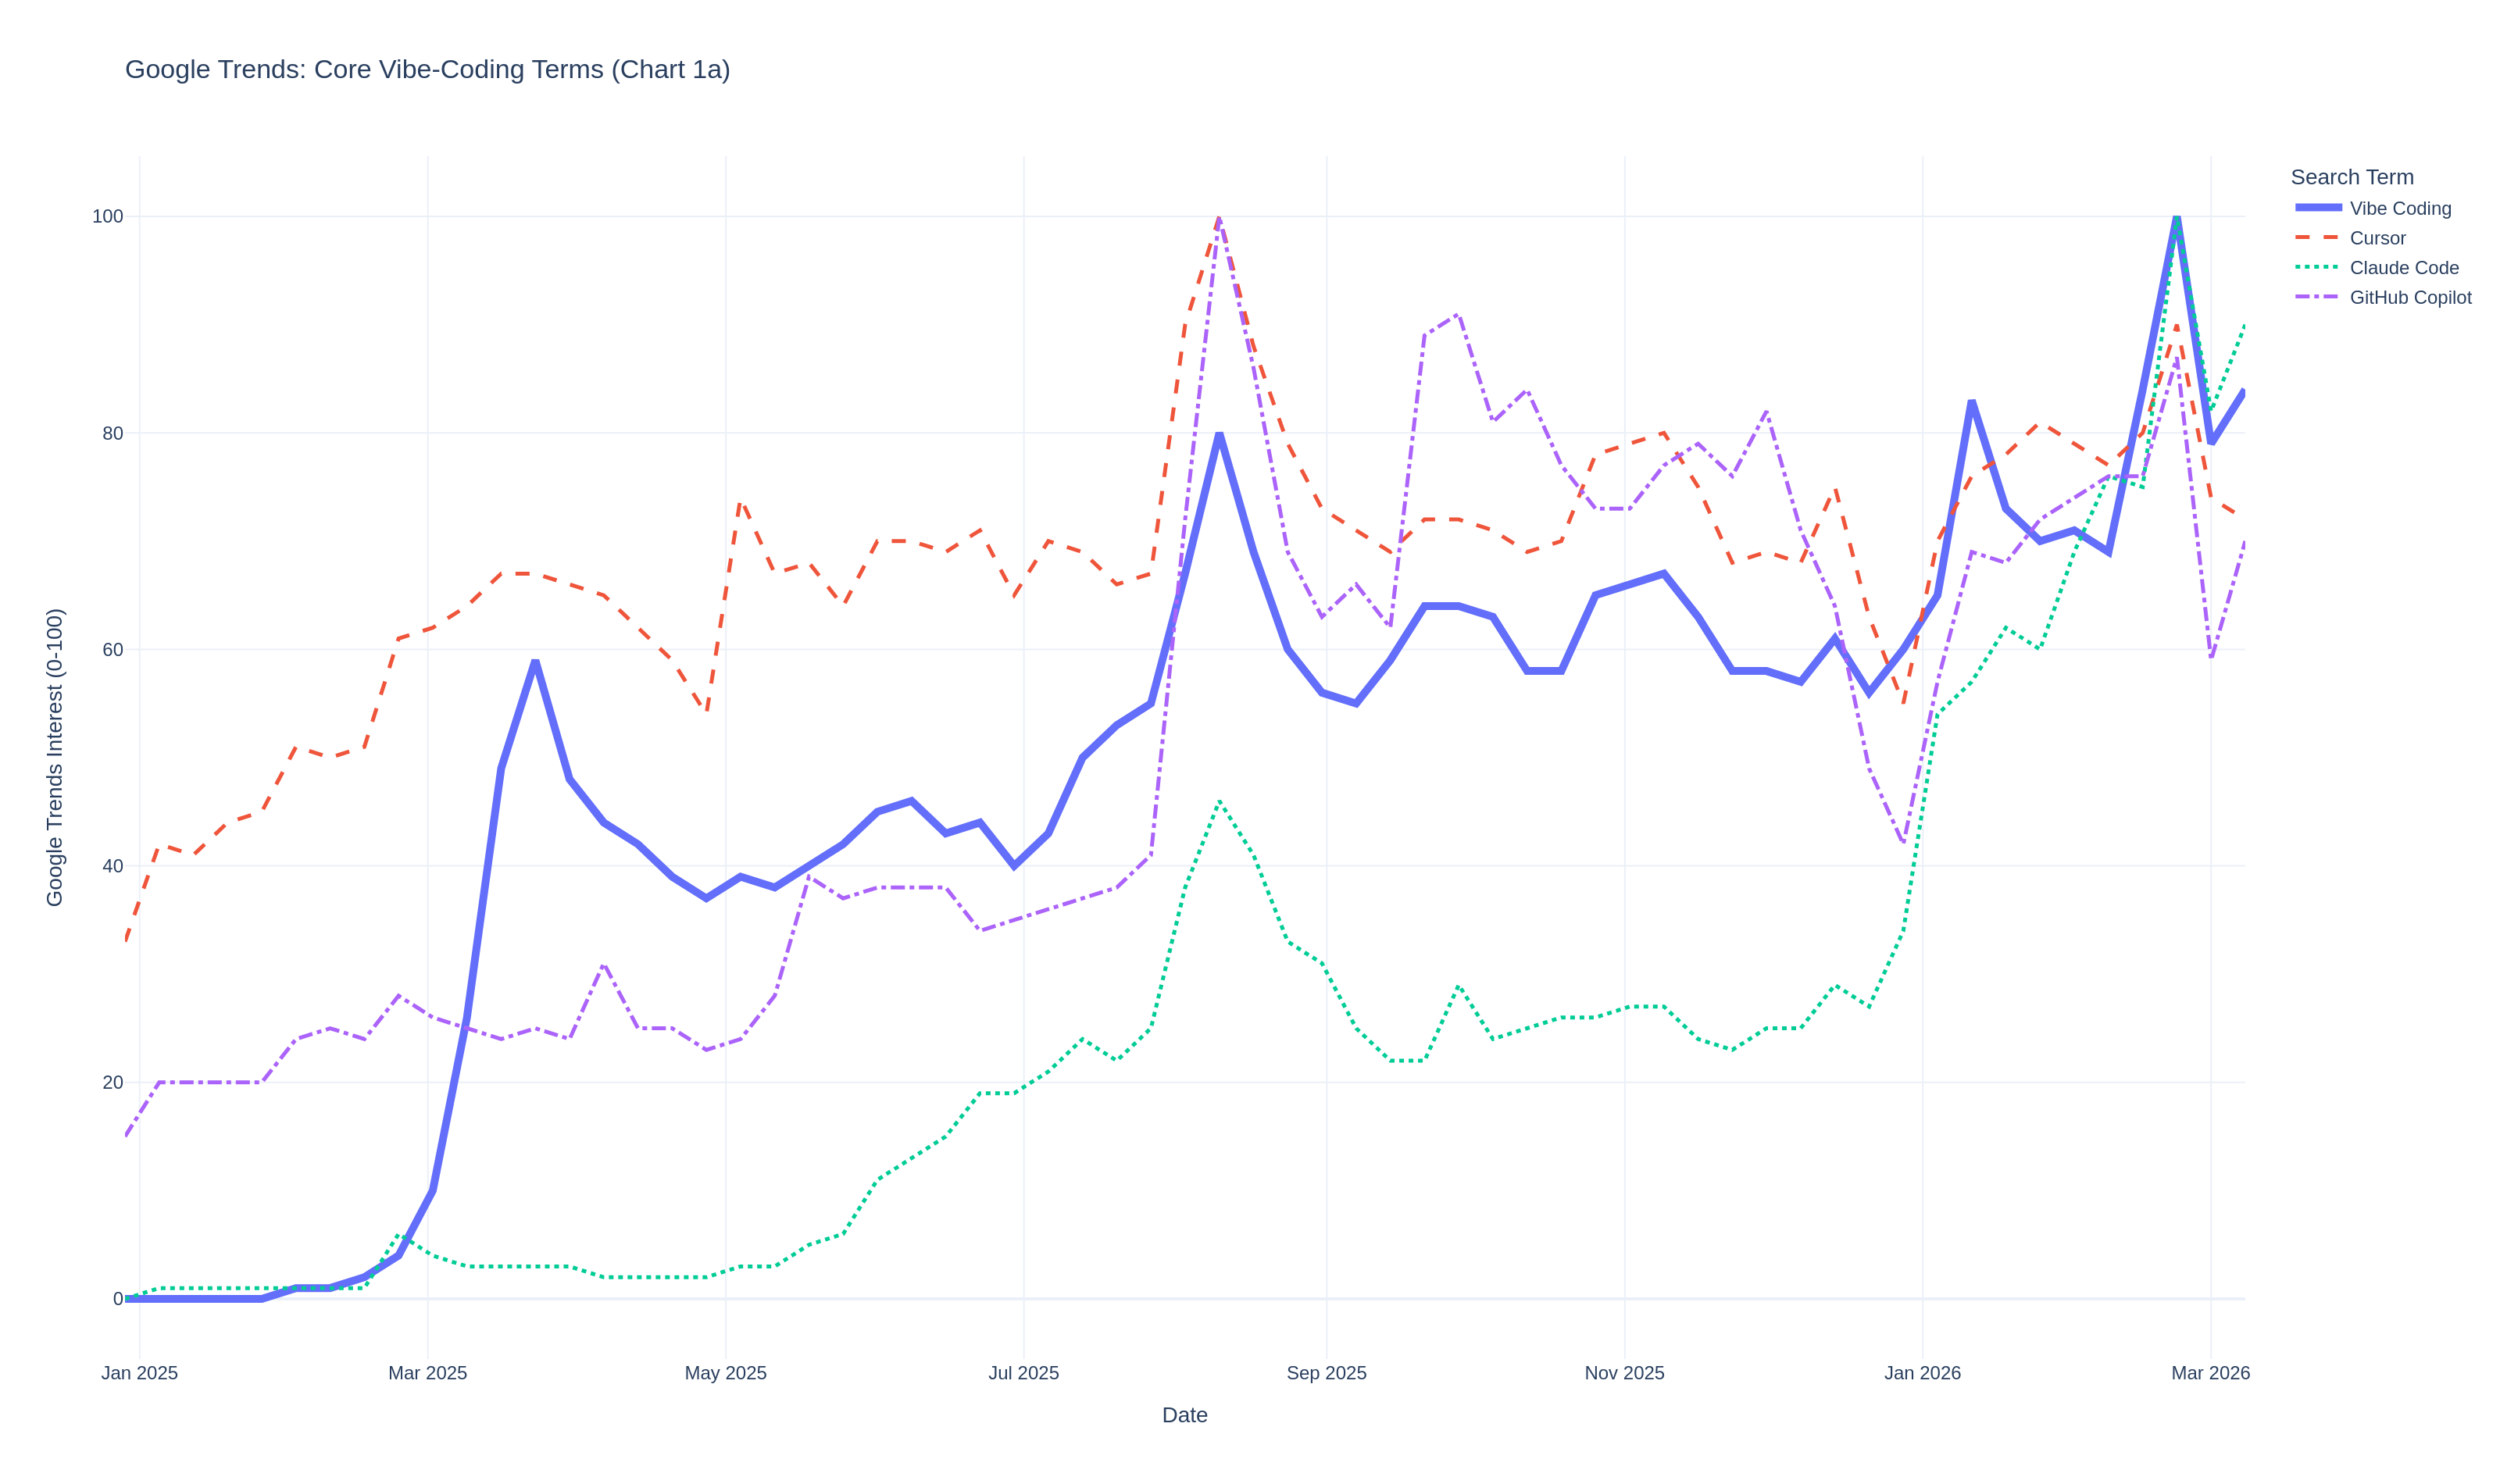
Claude Code’s rise is the most obvious late-period acceleration in this set (link). GitHub Copilot looks more mature and flatter by comparison, while attention shifts toward newer “agentic coding” labels and tools. One plausible context point is OpenAI’s Codex relaunch/push, which may have redistributed mindshare across names and workflows (link).
Also, this chart is intentionally selective. It does not include Google’s coding tools, for example.
Chart 1b: Platform wave (Vibe Coding + Lovable/Replit/Windsurf/Vercel v0/Bolt.new)
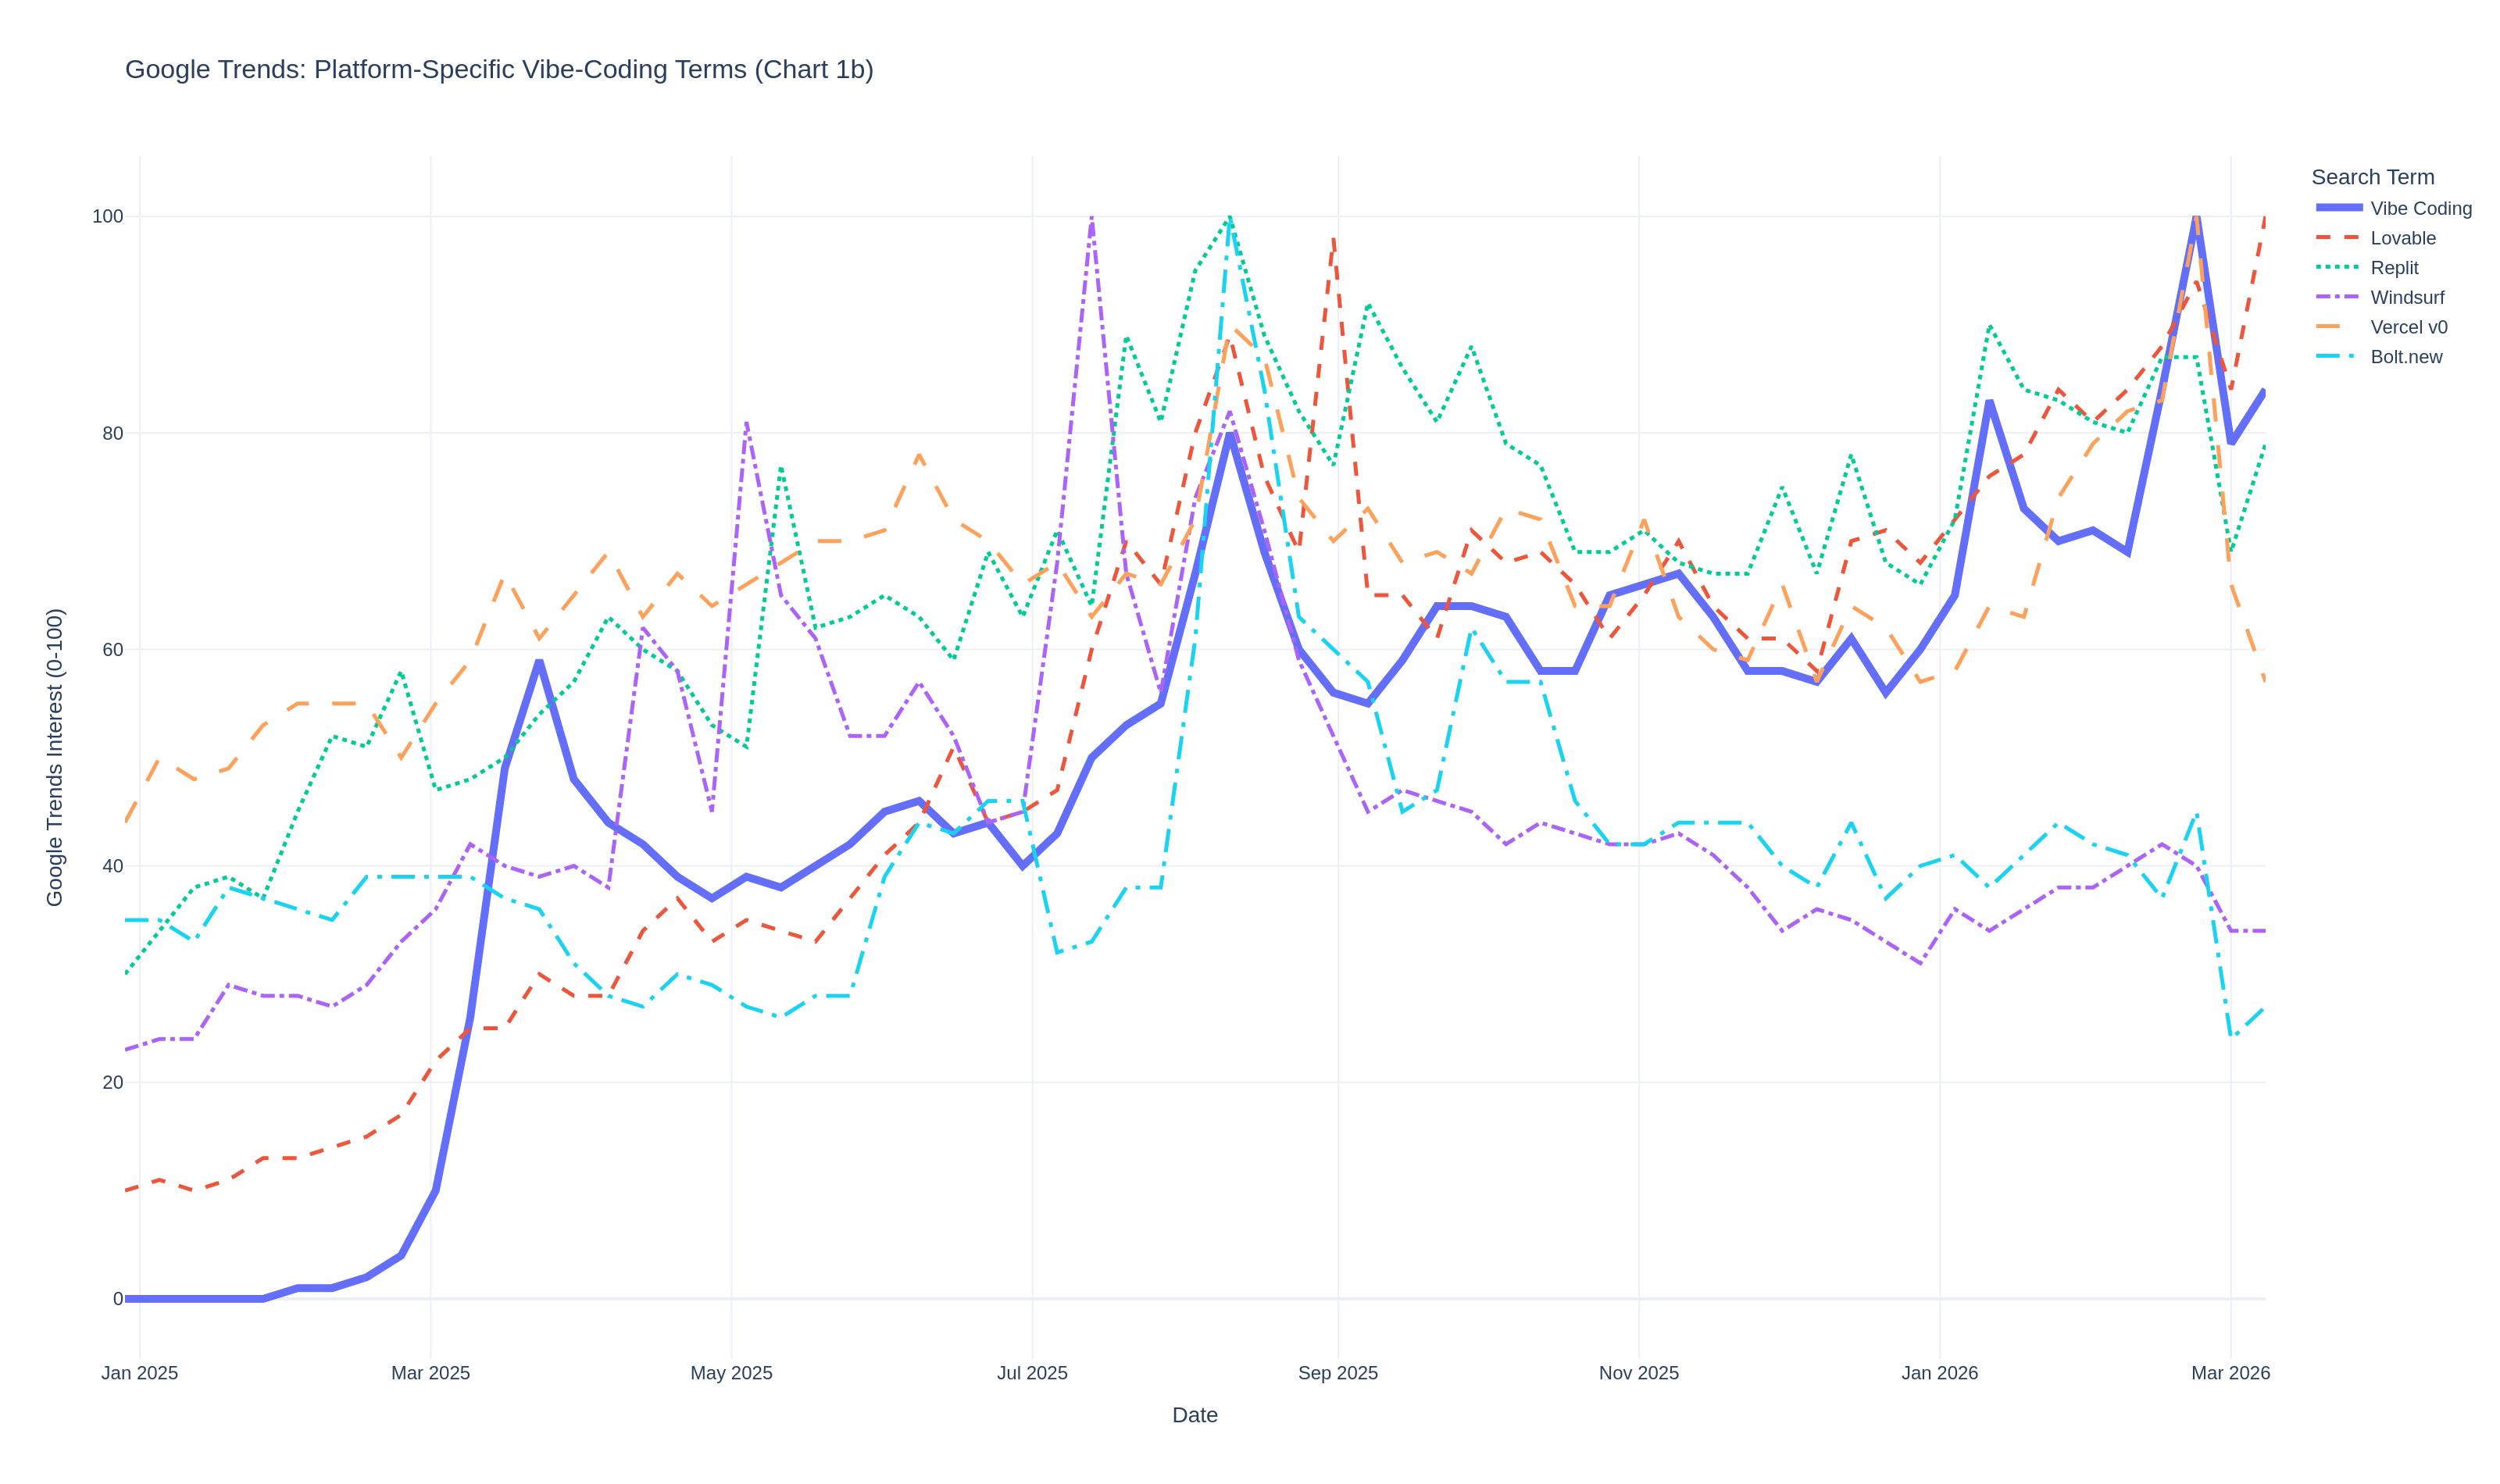
The “platform wave” look is pretty clear: a broad lift into August 2025, then separation.
- Lovable, Replit, and Vercel v0 hold up better afterward (with Lovable and v0 still very visible in later points) (link, link, link).
- Windsurf and Bolt.new fade relative to their peaks in this specific search slice (link, link).
Why might that happen? Usually it’s a mix: category crowding, feature convergence, and users consolidating around fewer default tools as “AI coding” becomes normal rather than novel.
Chart 2: “How do I get started?” query intent
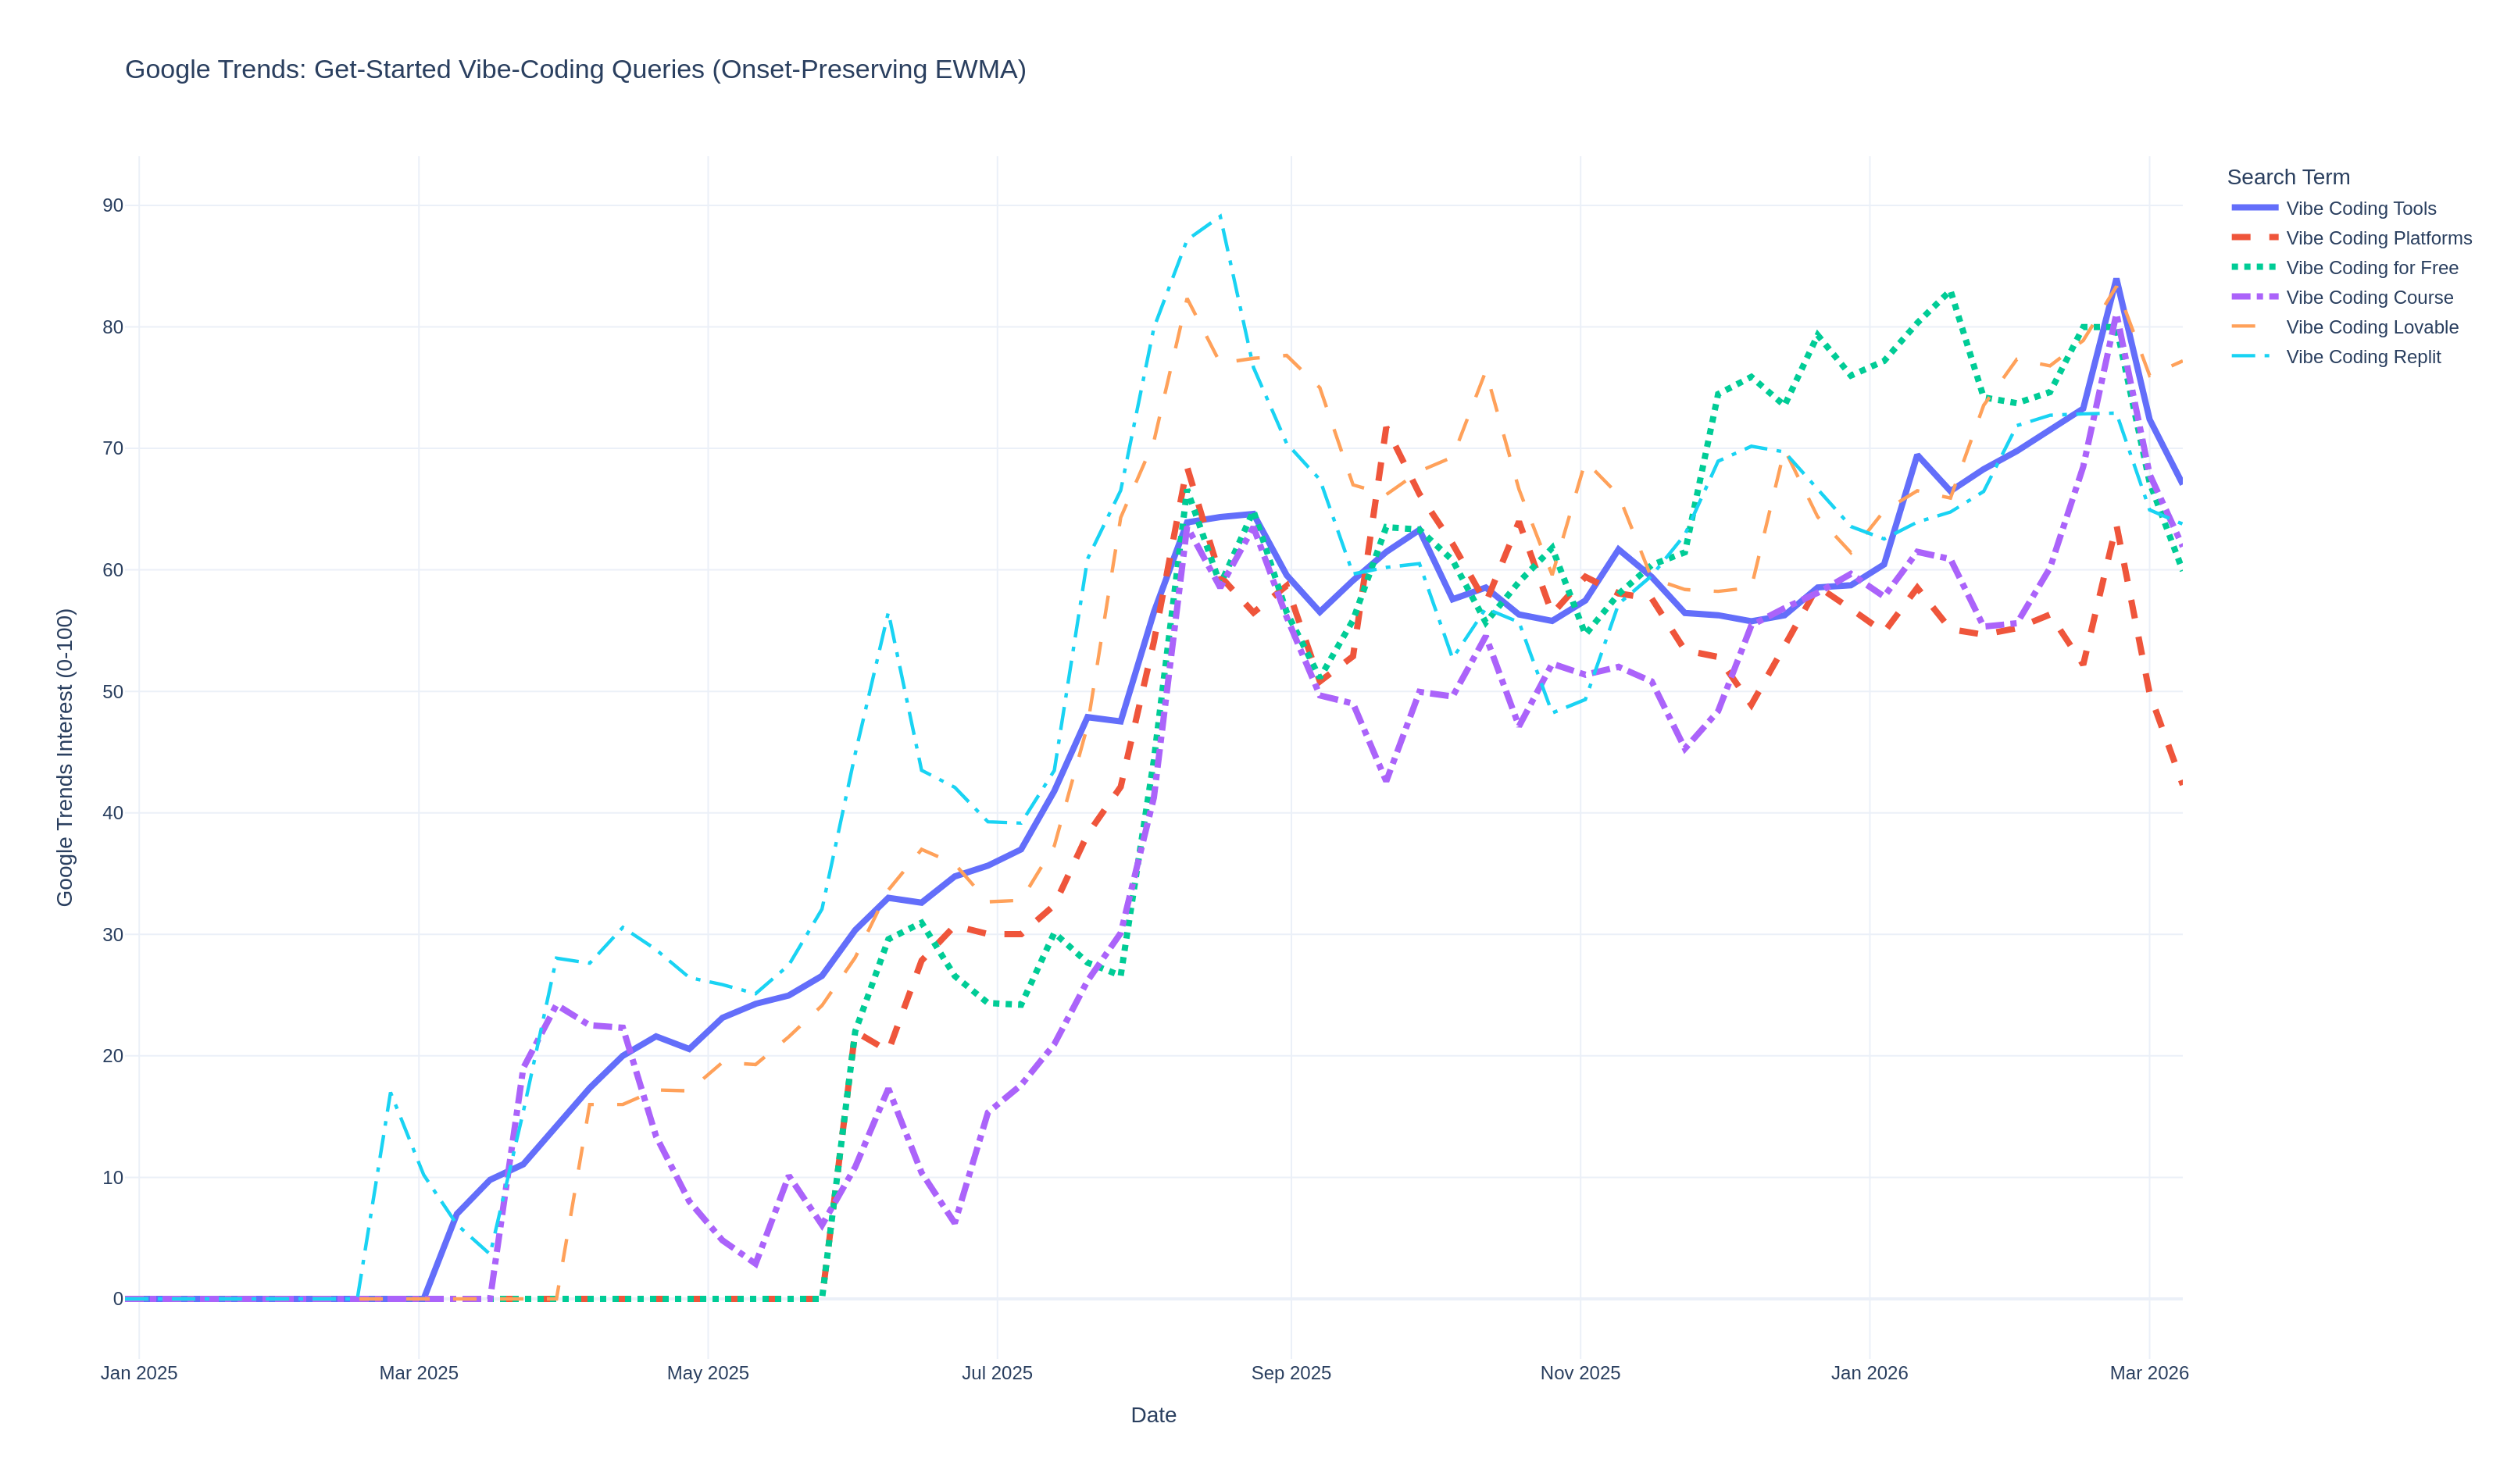
For this chart I filtered out terms that repeatedly dropped to zero in the second half of 2025 and used onset-preserving smoothing, so we keep direction without overreacting to one weekly bucket.
The key read is that generic “vibe coding” how-to intent does not explode upward on its own. Instead, intent fragments into tool-specific behavior: Claude workflows, Cursor workflows, Replit workflows, and so on.
Conclusions
My initial expectation was wrong. The term has not disappeared after 2025. It is still in active use in early 2026, and the broader behavior is of course even more entrenched.
“Vibe coding” still means “obtaining code (for a web site, a web app, any piece of software) through prompts”, but the assumptions of hard limitations, security flaws, and “only for beginners or non-coders” are totally passé, in a world where coding agents are becoming standard developer tools.
Data and method notes
- Data source: Google Trends weekly series, Jan 1, 2025 to Mar 8, 2026 (link).
- Important: this is relative index data, not absolute volumes.
- Charts are from local CSV pulls and custom Plotly PNG exports.

Leave a comment